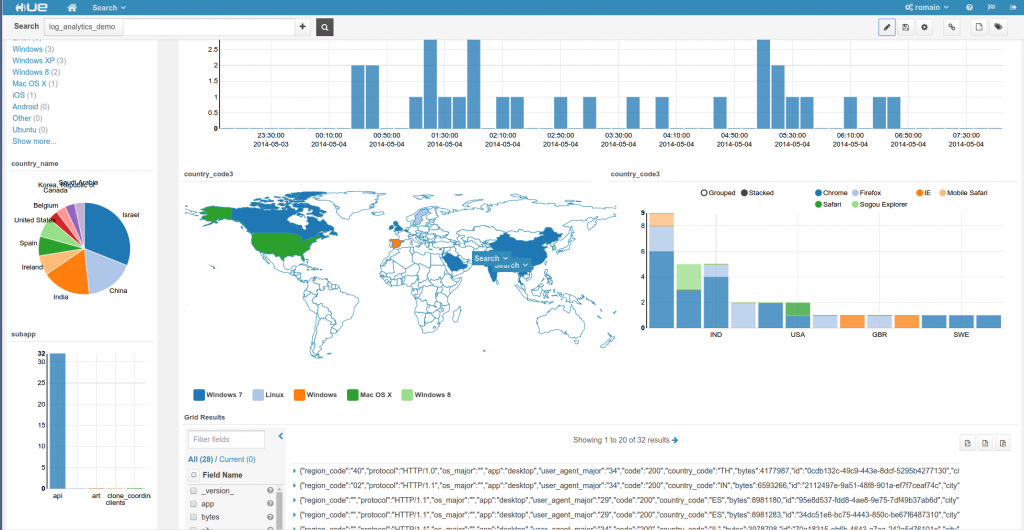
The Search dashboards got a series of new options and long awaited features in Hue 3.8. Here is a summary of the major improvements.
Regular users can now also create dashboards
Previously, only Hue admin could access the editor, which was not very practical.
Range & Up facet
Interval facets on any type of data has been supported since the first versions. However, some use cases would benefit more of range facets with one upper or lower bound open. Think like getting all the logs younger than 1 day or restaurants with ratings above 4 stars.
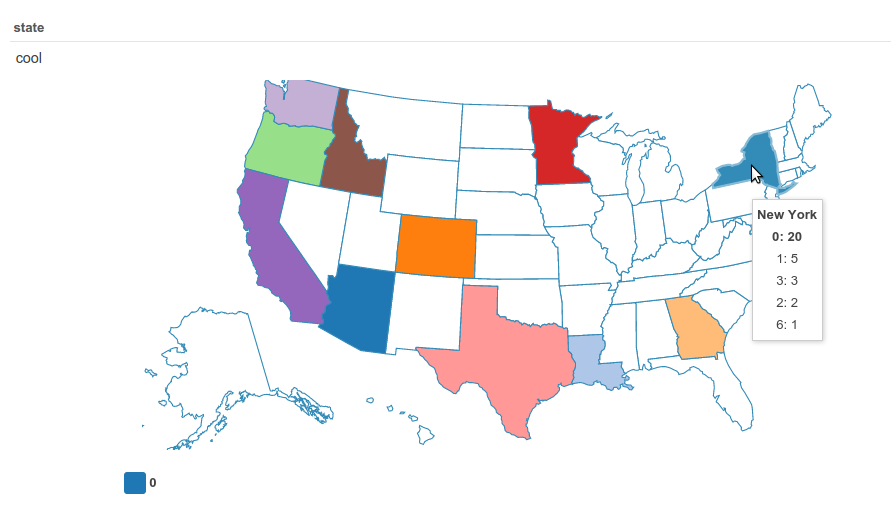
2D maps
The gradient map is handy for displaying the traffic by location. It now supports another dimension that way you can plot the Top Browsers, Operating Systems by country
Multiple widgets using the same fields
This feature is particularly useful for using a country code code field with several widgets or a date fields for a timeline and also a text facet. Previously each field could be used only once in a widget!
Collection aliases
All the aliased group of collections will now appear in the list of available collections. So just pick the name like any other collection. The UI also hides the core list by default to save some space.
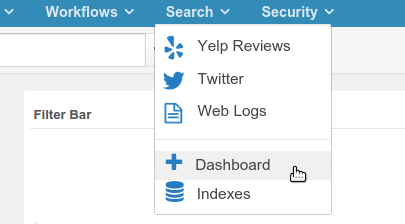
Enable only the Search app
Hue only uses the standard Solr API. This means that any Solr or Solr Cloud setup can also benefit from the dashboard UI. Here is how to customize Hue to only show the Search app and get started in a few clicks!
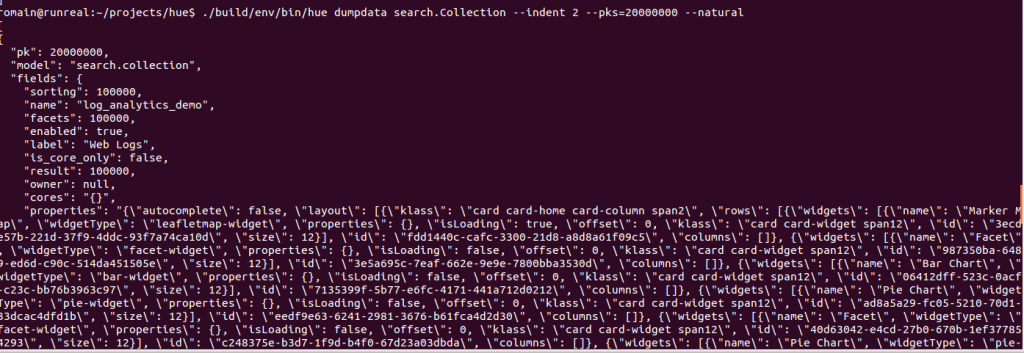
Export and import dashboard
Until we get the builtin support for exporting/importing any Hue documents, here is a new way to backup or move your existing dashboard to other installations.
Next!
A lot more is coming up, with a Date Widget for easily setting up a rolling timeline, more statistics and analytics facets!
Also in the pipeline is a revamp of the indexer designer for making collection index creation a 3-click operation.
Happy Searching!
As usual feel free to comment on the hue-user list or @gethue!


