Besides Hue Active Users Metric Improvements, we’ve also added a new Prometheus metrics number of queries, which shows how many queries were executed in the last ten minutes. Now both of them are available in Hue’s Grafana dashboard.
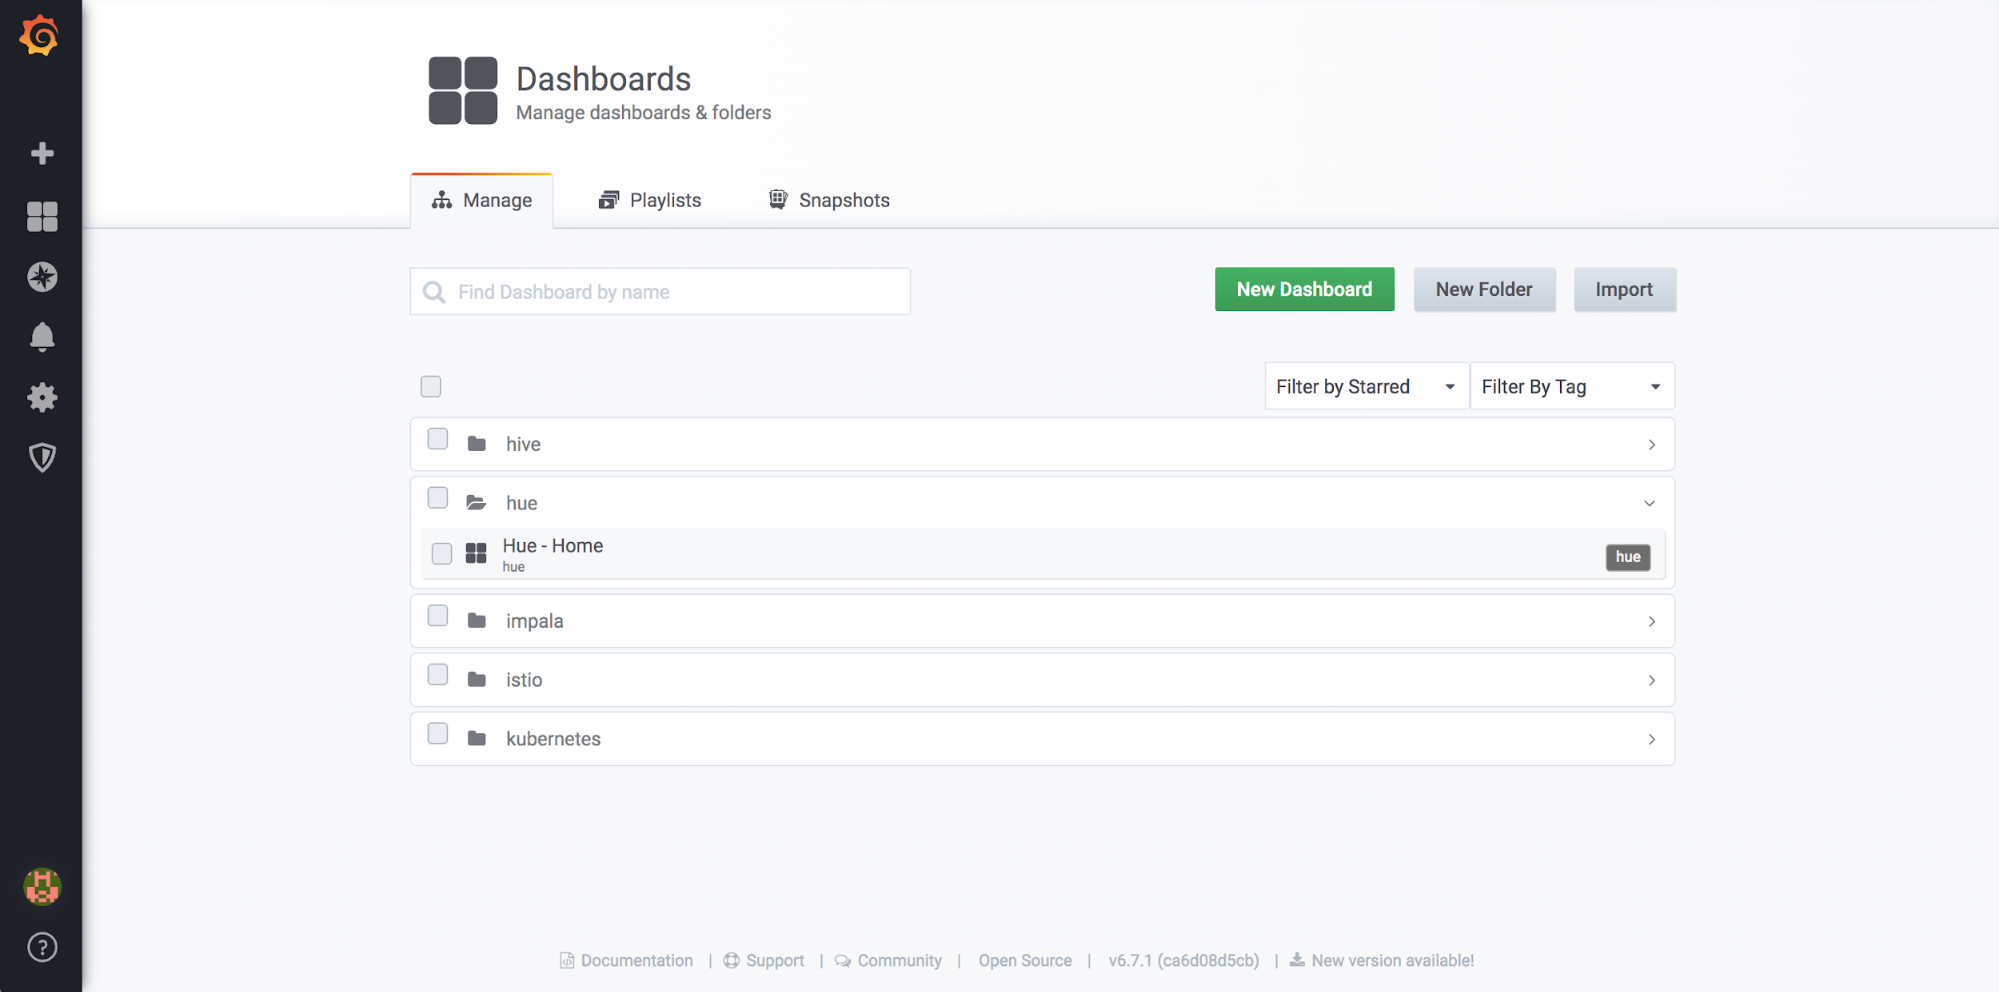
Let’s go to the Grafana dashboard list, you will find Hue’s Home dashboard in the Hue folder.
After opening the Home dashboard, you will see four panels which list CPU, memory, active users, and number of queries. You may upload hue-home.json to Grafana to generate the same graphs.
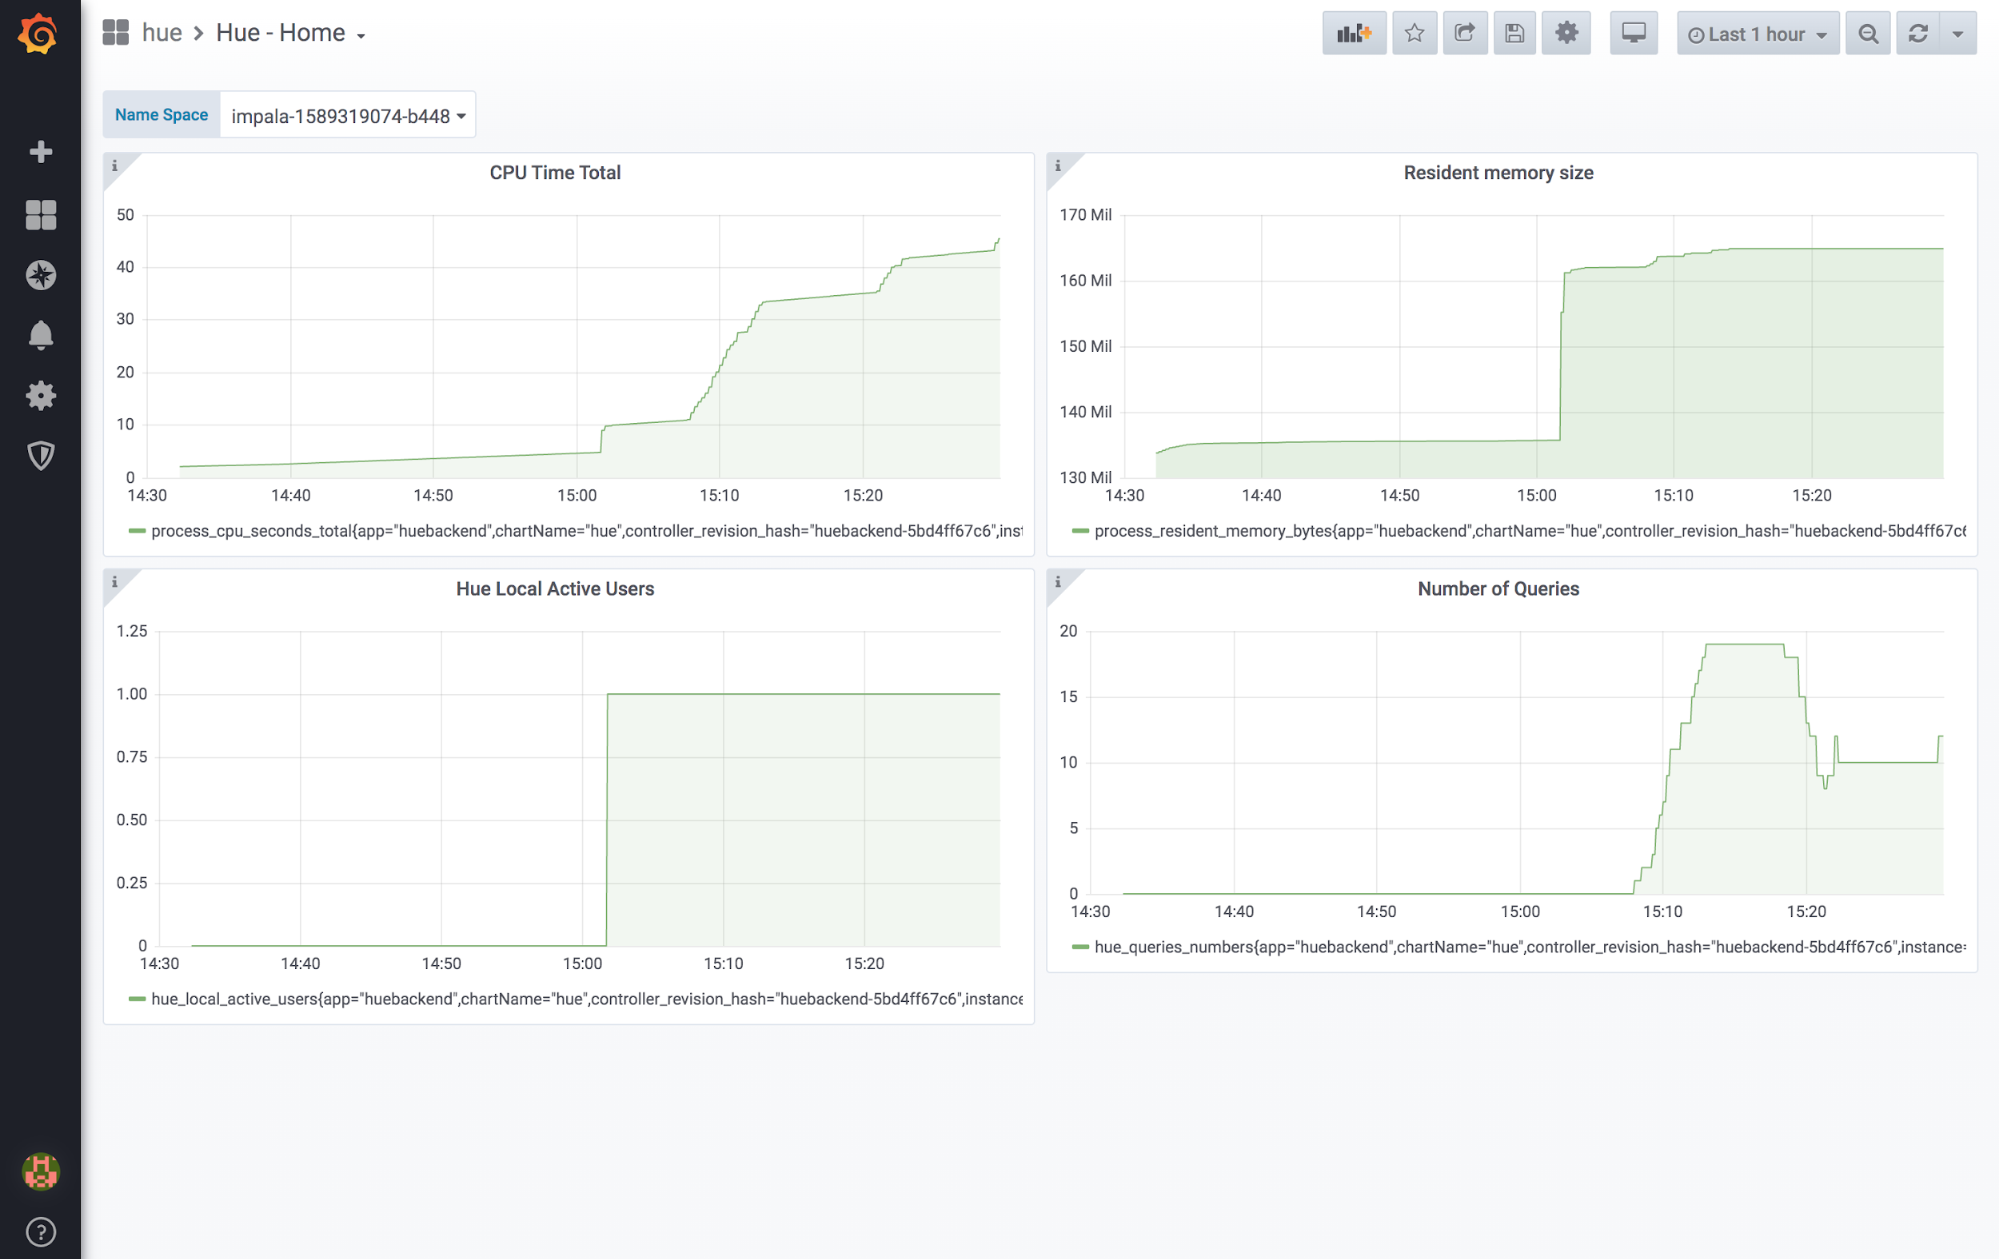
This dashboard will help administrators monitor Hue’s performance in the data warehouse.
Any feedback or question? Feel free to comment here or on the Forum and quick start Live SQL querying!
Ying Chen from the Hue Team