To understand the performance of Hue, we want to know how many active users in Hue–and more specifically–how many on each host. An active user is who sends requests from his/her browser to the Hue server in the last one hour. Recently, Hue got some improvements for providing and displaying better metrics.
-
On premise, Hue is using PyFormance implements /desktop/metrics endpoint. Cloudera Manager collects data via the endpoint and displays the metric “Active Users” in the Charts Library, but all hosts show the same number of active users. With HUE-9210, the active users metric on each host is collected based on its hostname (see screenshot).
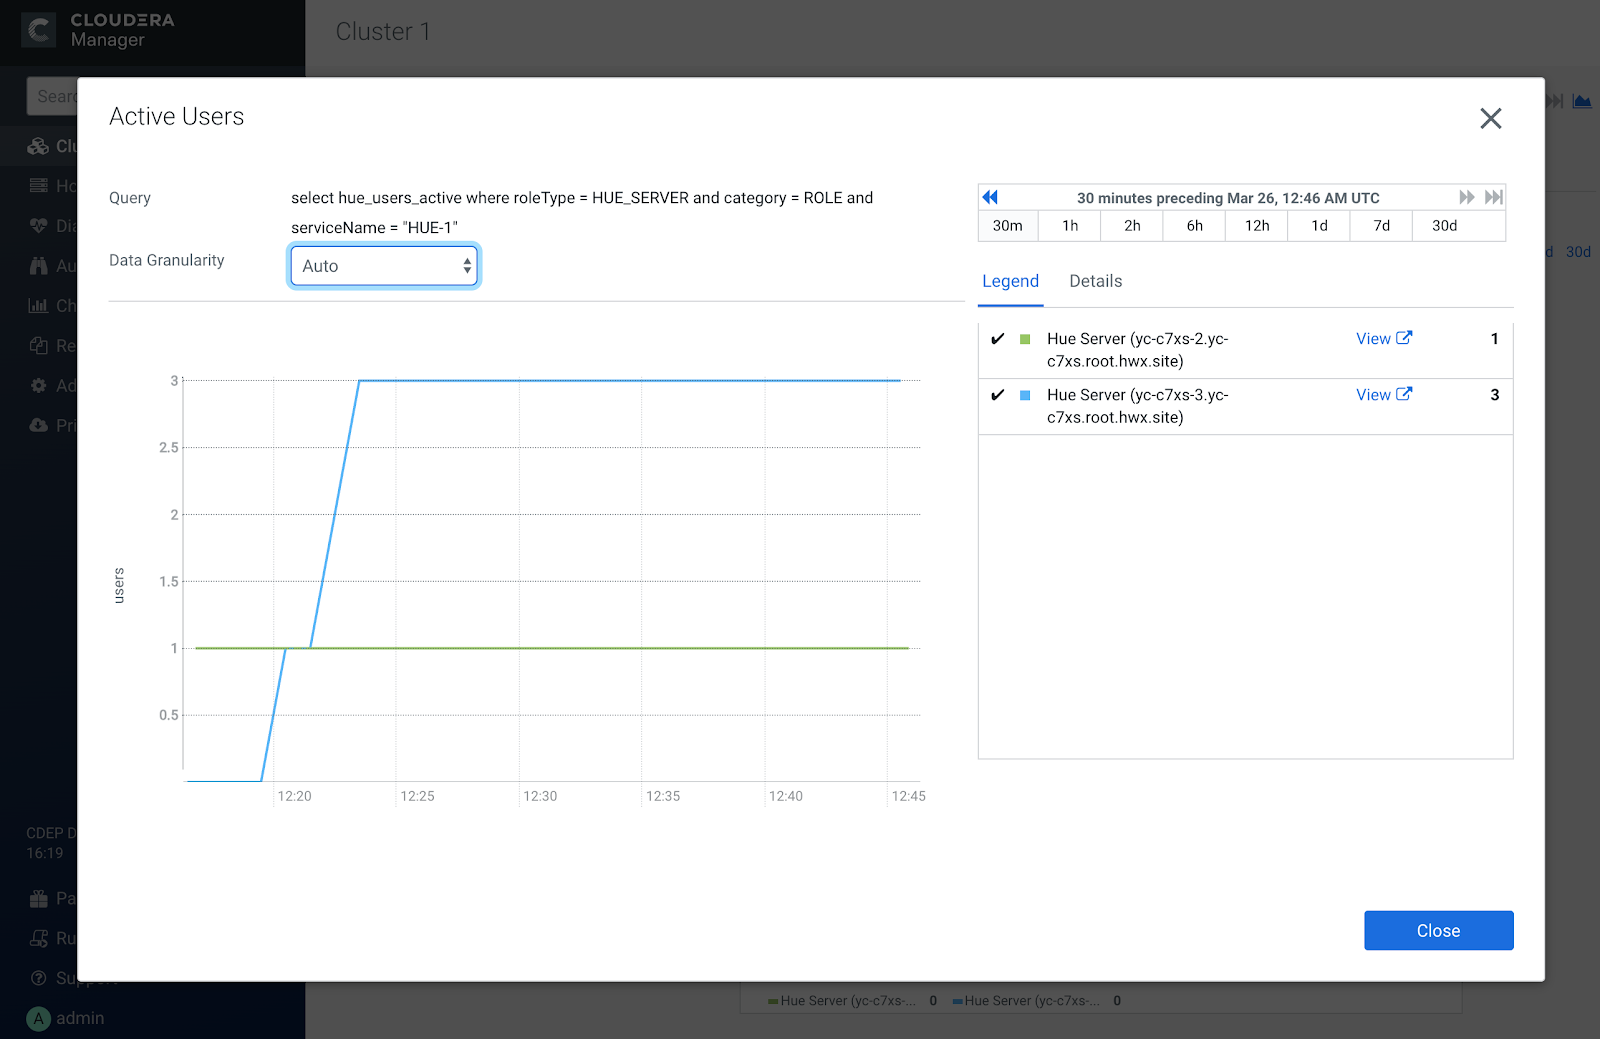
Here we can see three users on the blue Hue API server role and one on the green
-
In Kubernetes, Hue is using django-prometheus to implement endpoint /metrics. With HUE-9194, we added two new active users metrics to display in Prometheus server. You may set up your Prometheus server without Kubernetes. Once setup is done and the server is started, open your browser at localhost:9090. From the drop down menu of metrics, you may find hue_active_users and hue_local_active_users.
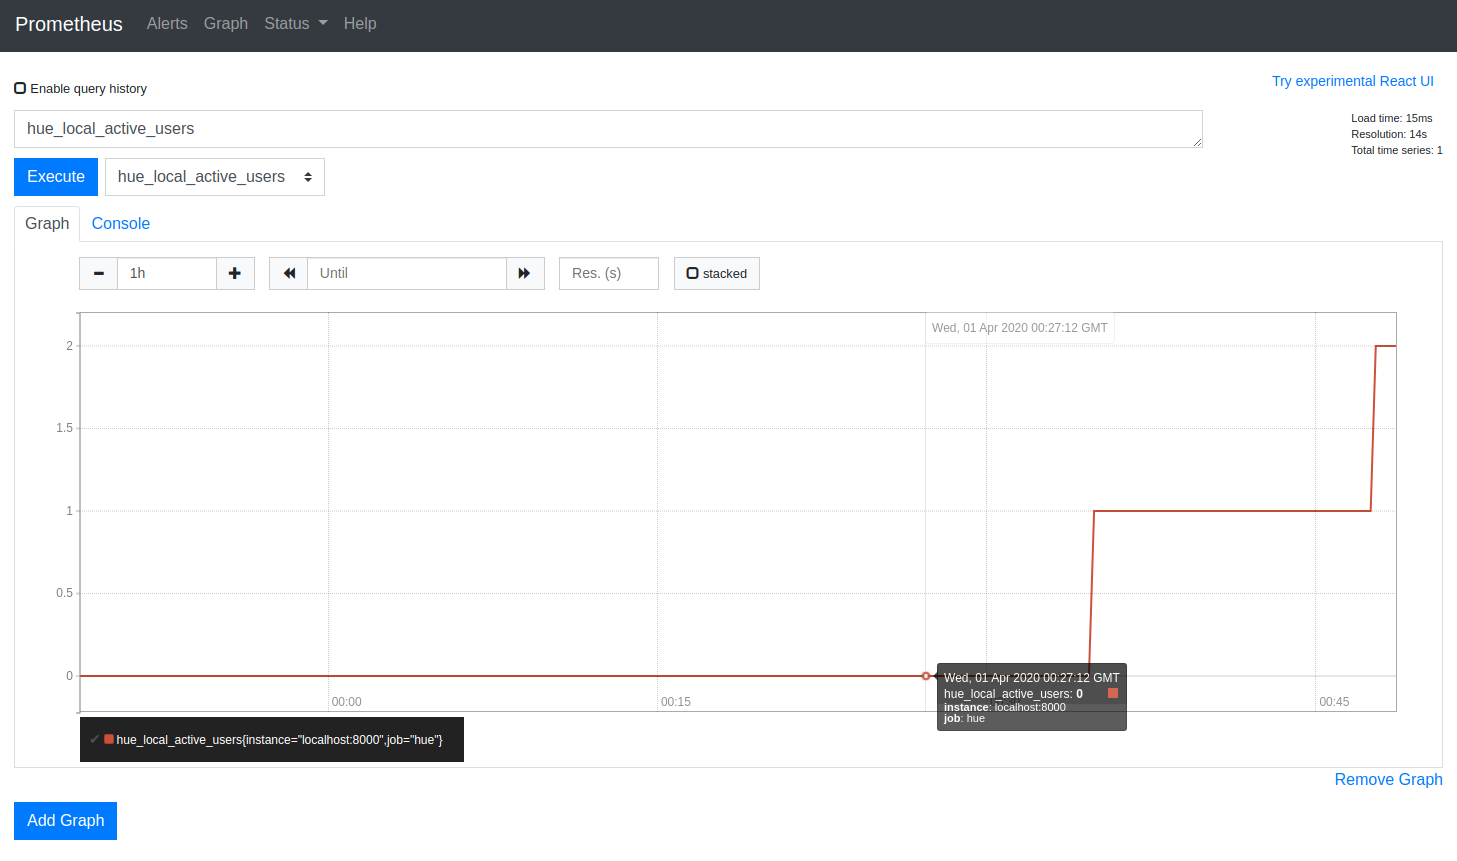
This hue_local_active_users is showing active users in specific container bases on its hostname, while hue_active_users will show all users in the data warehouse.
Any feedback or questions? Feel free to comment here or on the Forum or @gethue and quick start SQL querying!
Ying Chen from the Hue Team