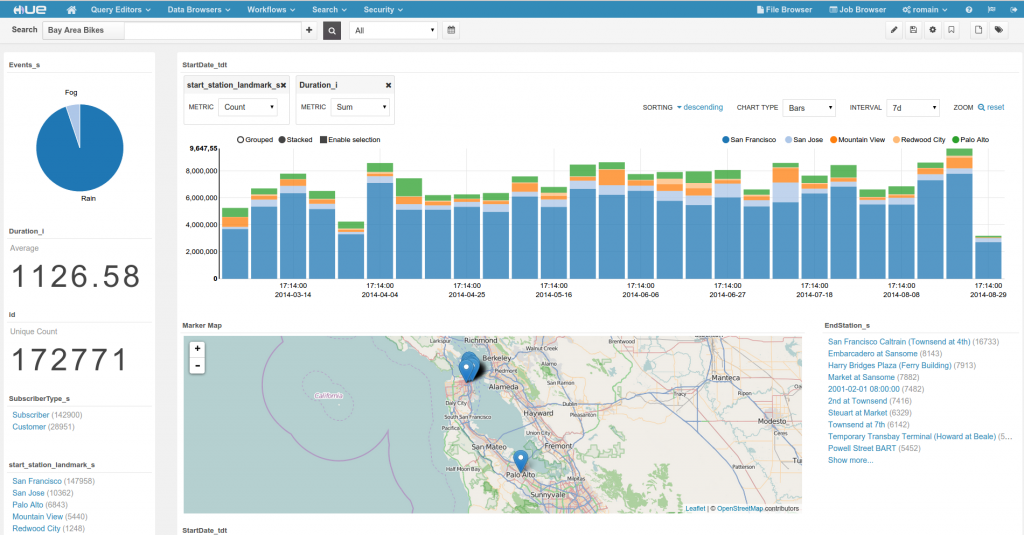
In this tutorial, we use public data from Bay Area BikeShare and visualize bike trips patterns and their users to understand more the usage of the platform. Hue provides a Dynamic Search dashboard as well as the new Spark Notebook for enriching the data.
We recommend to start with the Trip dataset from http://www.bayareabikeshare.com/datachallenge and index it into Solr. For impatient people, we provide a subset of trips ready to be indexed as well as the weather data to be processed later with Spark. The Search Dashboard can be downloaded here, the Notebook can be downloaded and imported with Hue 3.9 or just copy pasted.
This demo combined with Real-time Spark Streaming have been presented at conference like Hadoop Summit and Big Data Day LA.
Happy Biking!

As usual feel free to comment on the hue-user list or @gethue!
Tip
A quick way to index the data with Solr:
bin/solr create_collection  -c  bikes

URL=http://localhost:8983/solr

u="$URL/bikes/update?commitWithin=5000"

curl $u -data-binary @/home/test/index_data.csv -H 'Content-type:text/csv'
