Greetings Data Explorers!
We’ve been looking for ways to help debug performance issues with your Impala queries. Let’s preface by saying that this new feature is a work in progress and we’re looking to add more with the help of your feedback.
After finding data in the Catalog and using the Query Assistant, end users might wonder why their queries are taking a lot of time to execute. Build up on top of the Impala profiler, this new feature educates them and surface up more information so that they can be more productive by themselves. Here is a scenario that showcases the flow:
Execution Timeline
To give you a feel for the new features, we'll execute a few queries.
SELECT *

FROM

transactions1g s07 left JOIN transactions1g s08

ON ( s07.field_1 = s08.field_1) limit 100
transactions1g is a 1GB table and the self join with no predicates will force a network transfer of the whole table.
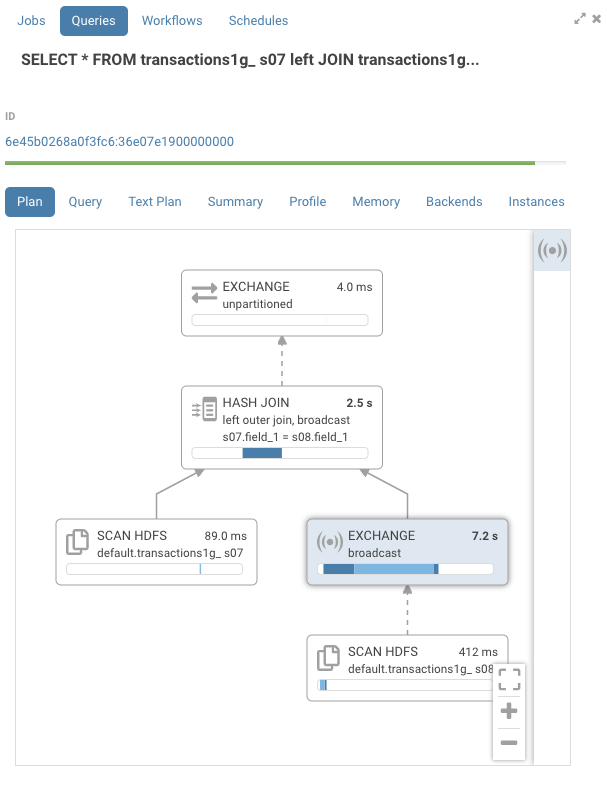
Looking at the profile, you can see a number on the top right of each node that represent its IO and CPU time. There's also a timeline that gives an estimated representation of when that node was processed during execution. The dark blue color is the CPU time, while the lighter blue is the network or disk IO time. In this example, we can see that the hash join ran for 2.5s. The exchange node, which does the network transfer between 2 hosts, was the most expensive node at 7.2s.
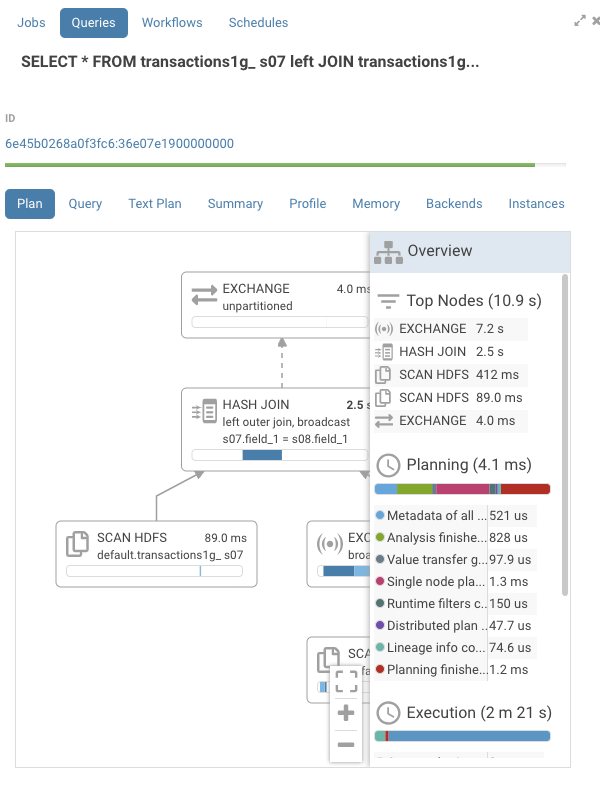
Detail pane
On the right hand side, there is now a pane that is closed by default. To open or close press on the header of the pane. There, you will find a list of all the nodes sorted by execution time, which makes it easier to navigate larger execution graphs. This list is clickable and will navigate to the appropriate node.
Events
Pressing on the exchange node, we find the execution timeline with a bit more detail.
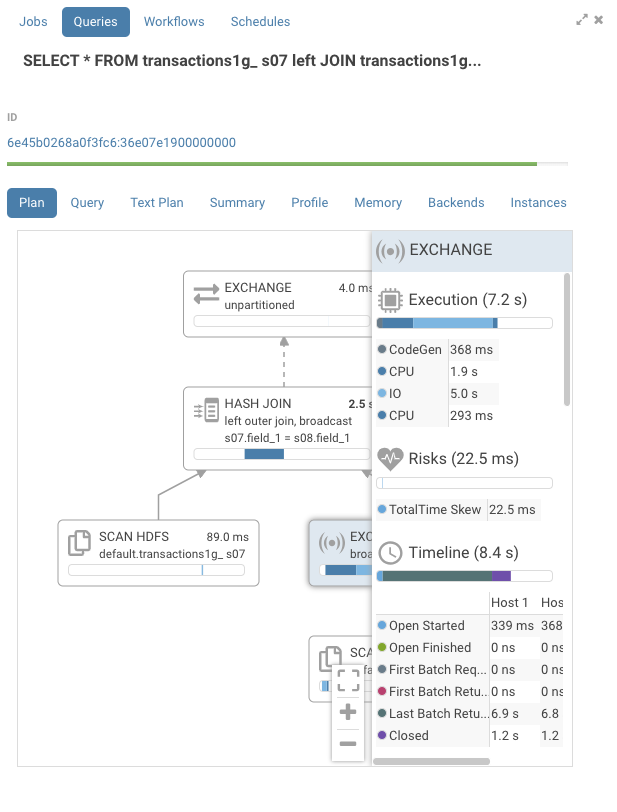
We see that the IO was the most significant portion of the exchange.
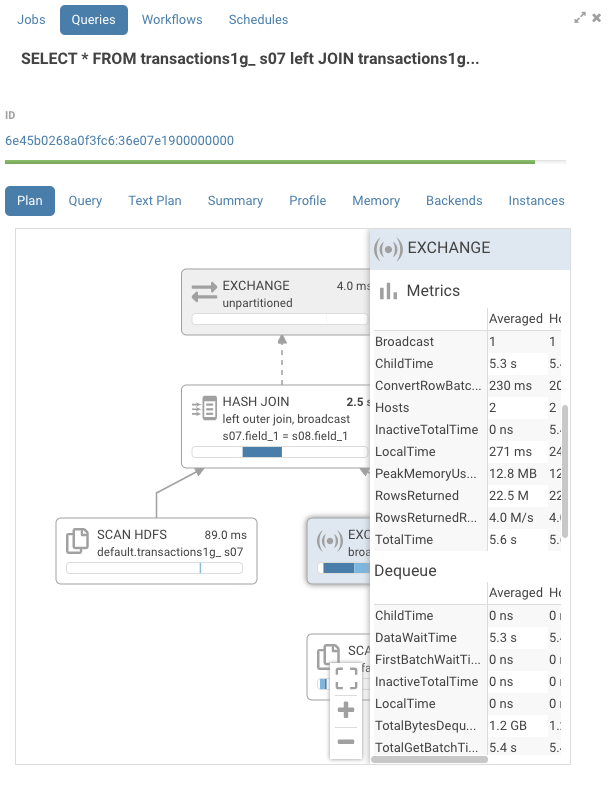
Statistics by host
The detail pane also contains detailed statistics aggregated per host per node such as memory consumption and network transfer speed.
Risks
In the detail pane, for each node, you will find a section titled risks. This section will contain hints on how to improve performance for this operator. Currently, this is not enabled by default. To enable it, go to your Hue ini file and enable this flag:
[notebook]

enable_query_analysis=true
CodeGen
Let's look at a few queries and some of the risks that can be identified.
SELECT s07.description, s07.salary, s08.salary,

s08.salary - s07.salary

FROM

sample_07 s07 left outer JOIN sample_08 s08

ON ( s07.code = s08.code)

where s07.salary > 100000
sample_07 & sample_08 are small sample tables that come with Hue.
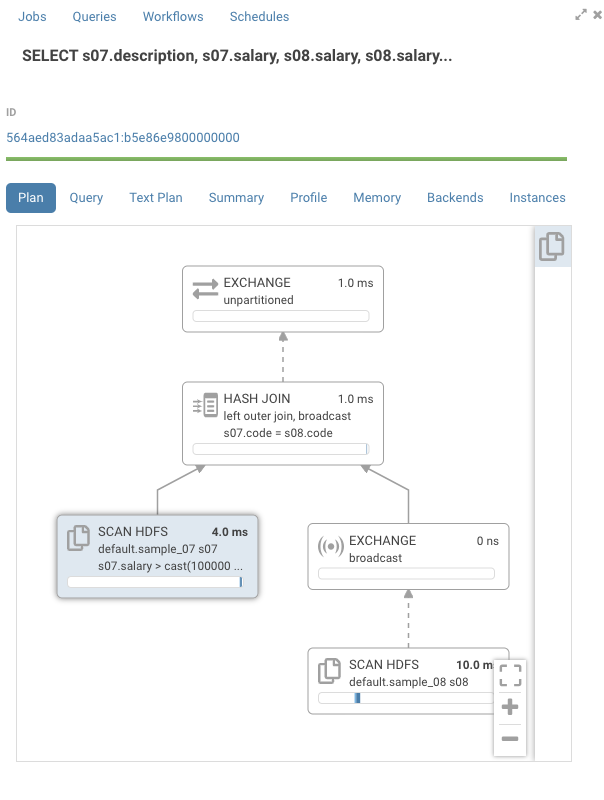
Looking at the graph, the timelines are mostly empty. If we open one of the nodes we see that all the time is taken by “CodeGen”.
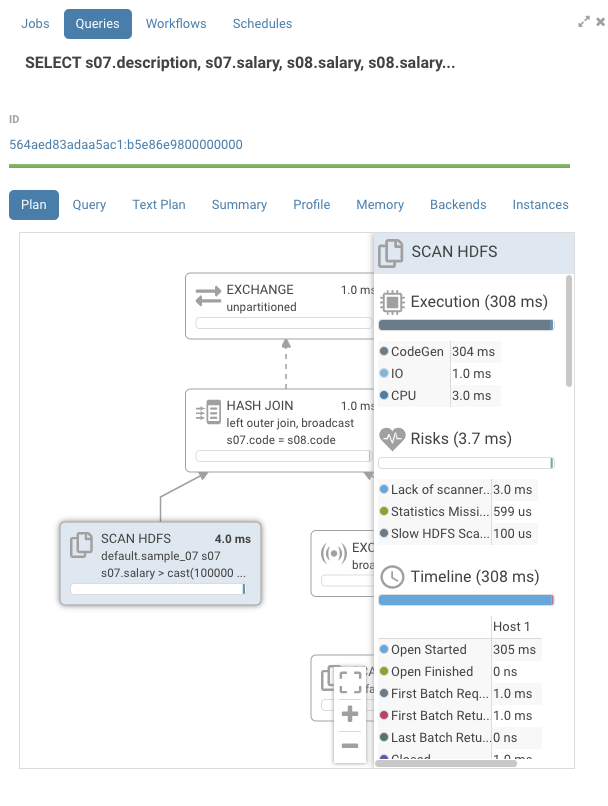
Impala compiles SQL requests to native code to execute each node in the graph. On queries with large table this gives a large performance boost. On smaller tables, we can see that CodeGen is the main contributor to execution time. Normally, Impala disables CodeGen with tables of small sizes, but Impala doesn't know it's a small table as is pointed out in the risks section by the statement “Statistics missing”. Two solutions are available here:
- Adding the missing statistics. One way to do this is to execute the following command:
compute stats sample_07;

compute stats sample_08;

</code></pre>

This is usually the right thing to do, but on larger tables it can be quite expensive.</li>

  * [Disable codegen][9] for the query via:
    <pre><code class="bash">

    set DISABLE_CODEGEN=true

    </code></pre></ol>

[<img class="aligncenter size-medium wp-image-5673" src="https://cdn.gethue.com/uploads/2019/03/Screen-Shot-2019-03-07-at-9.52.37-AM.png"/>][10]

After rerunning the query, we see that CodeGen is now gone.

### Join Order

If we open the join node, there's a warning for wrong join order.

[<img class="aligncenter wp-image-5678" src="https://cdn.gethue.com/uploads/2019/03/Screen-Shot-2019-03-07-at-4.50.54-PM.png"/>][11]

Impala prefers having the table with the larger size on the [right hand side][12] of the graph, but in this case the reverse is true. Normally, Impala would optimize this automatically, but we saw that the statistics were missing for the tables being joined. There a few ways we could fix this:

  1. Add the missing statistics as described earlier.
  2. Rewrite the query the change the join order:
    <pre><code class="bash">

    SELECT s07.description, s07.salary, s08.salary,

    s08.salary - s07.salary

    FROM

    sample_08 s08 left outer JOIN sample_07 s07

    ON ( s07.code = s08.code)

    where s07.salary > 100000

    </code></pre>

[<img src="https://cdn.gethue.com/uploads/2019/03/Screen-Shot-2019-03-07-at-9.57.14-AM.png"/>][13]

The warning is gone and the execution time for the join is down.

### Spilling

Impala will execute all of its operators in memory if enough is available. If the execution does not all fit in memory, Impala will use the [available disk][14] to store its data temporarily. To see this in action, we'll use the same query as before, but we'll set a [memory limit][15] to trigger spilling:

<pre><code class="bash">

set MEM_LIMIT=1g;

select *

FROM

transactions1g s07 left JOIN transactions1g s08

ON ( s07.field_1 = s08.field_1);

</code></pre>

[<img class="aligncenter wp-image-5676" src="https://cdn.gethue.com/uploads/2019/03/Screen-Shot-2019-03-07-at-11.40.24-AM.png"/>][16]

Looking at the join node, we can see that there's an entry in the risk section about a spilled partition. Typically, the join only has CPU time, but in this case it also has IO time due to the spill.

### Kudu Filtering

Kudu is one of the supported storage backends for Impala. While Impala stand alone can query a variety of file data formats, Impala on Kudu allows fast updates and inserts on your data, and also is a better choice if small files are involved. When using Impala on Kudu, Impala will push down some of the operations to Kudu to reduce the data transfer between the two. However, Kudu does not support all the [operators][17] that Impala support. For example, at the time of writing, Impala support the ‘like’ operator, but Kudu does not. In those cases, all the data that cannot be natively filtered in Kudu is transferred to Impala where it will be filtered. Let’s look at a behavior difference between the two.

<pre><code class="bash">

SELECT * FROM transactions1g_kudu s07 left JOIN transactions1g_kudu s08 on s07.field_1 = s08.field_1

where s07.field_5 LIKE '2000-01%';

</code></pre>

[<img class="aligncenter wp-image-5680" src="https://cdn.gethue.com/uploads/2019/03/Screen-Shot-2019-03-07-at-5.00.59-PM.png"/>][18]

When we look at the graph, we see that on the Kudu node we have both IO, which represent the time spent in Kudu, and CPU, which represent the time spent in Impala, for a total of 2.1s. In the risk section, we can also find a warning that Kudu could not evaluate the predicate.

<pre><code class="bash">

SELECT * FROM transactions1g_kudu s07 left JOIN transactions1g_kudu s08 on s07.field_1 = s08.field_1

where s07.field_5 <= '2000-01-31' and s07.field_5 >= '2000-01-01';

</code></pre>

[<img src="https://cdn.gethue.com/uploads/2019/03/Screen-Shot-2019-03-07-at-4.02.33-PM.png"/>][19]

When we look a the graph, we see that on the Kudu node now mostly has IO for a total time 727ms.

### Others

You might also have queries where the nodes have short execution time, but the total duration time is long. Using the same query, we see all the nodes have sub 10ms execution time, but the query execution was 7.9s.

[<img class="aligncenter wp-image-5675" src="https://cdn.gethue.com/uploads/2019/03/Screen-Shot-2019-03-07-at-10.56.07-AM.png"/>][20]

Looking at the global timeline, we see that the planning phase took 3.8s with most of the time in metadata load. When Impala doesn't have metadata about a table, which can happen after a user executes:

<pre><code class="bash">

invalidate metadata;

</code></pre>

Impala has to refetch the metadata from the metastore. Furthermore, we see that the second most expensive item at 4.1s is first row fetched. This is the time it took the client, Hue in this case, to fetch the results. While both of these events are not things that a user can change, it's good to see where the time is spent.

<p class="p1">
  As always, if you have any questions, feel free to comment here or on the <a href="http://groups.google.com/a/cloudera.org/group/hue-user">hue-user list</a> or <a href="https://twitter.com/gethue">@gethue</a>!
</p>