If Hue is running slow, how to find out the root cause? Now, in 4.3, Hue comes with a handy tool for profiling HTTP requests and responses thanks to Django Debug Toolbar and Django Debug Panel.
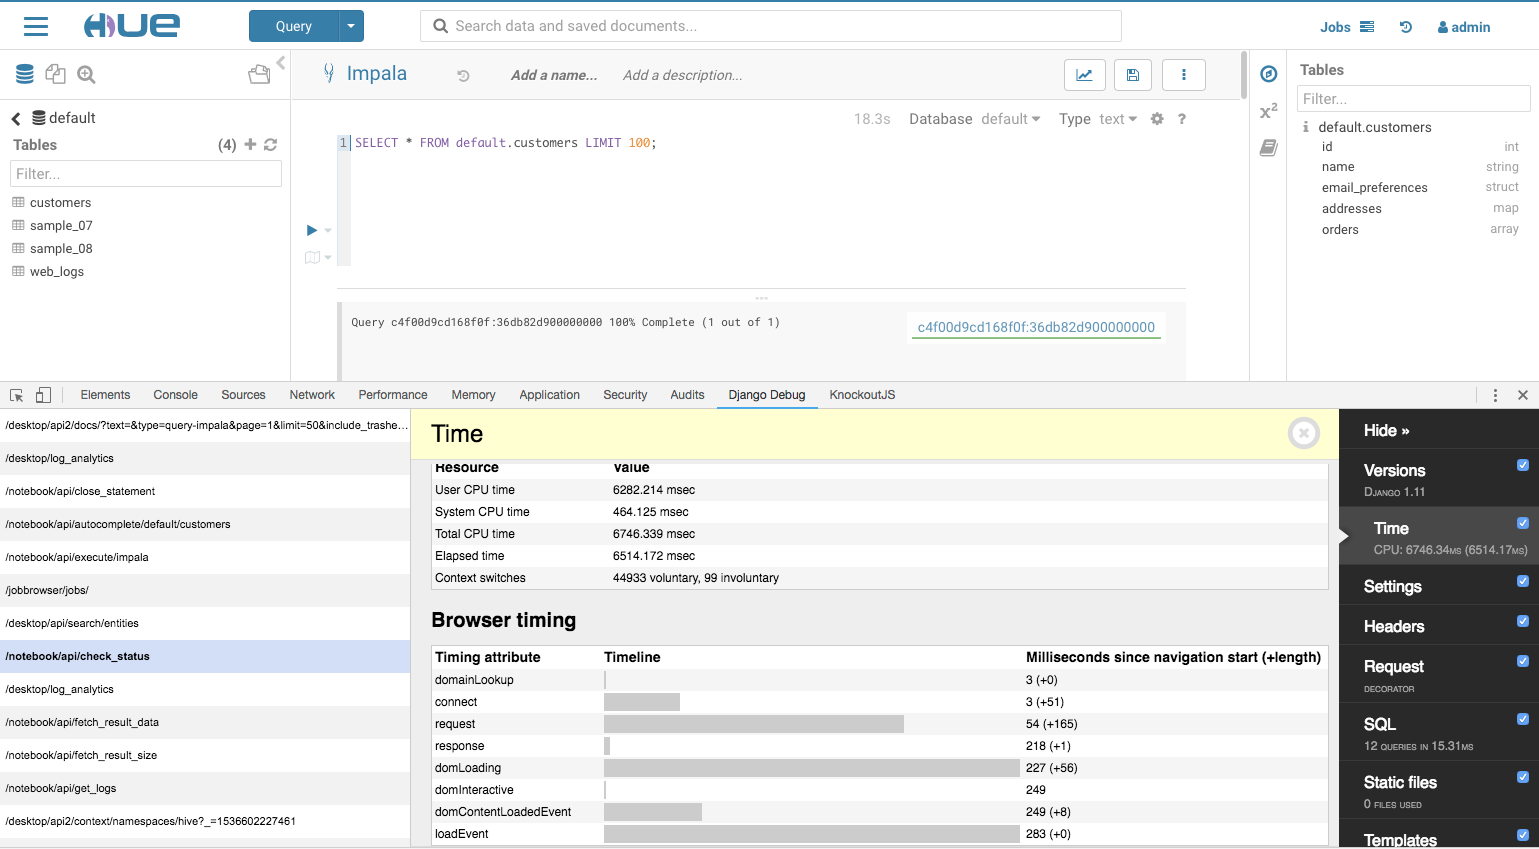
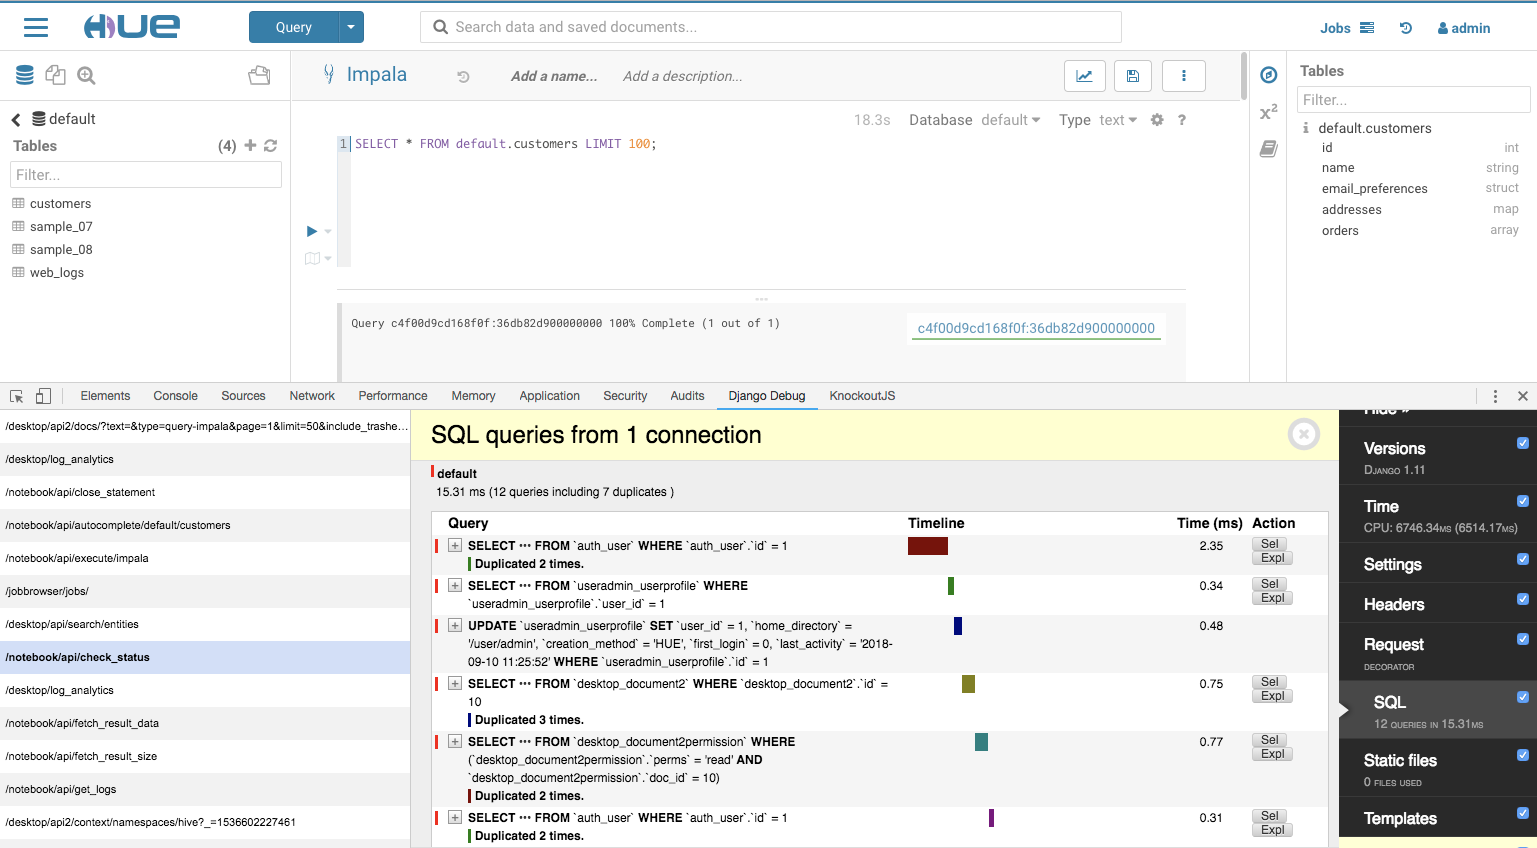
As the screenshots above, the Django Debug panel captures requests and list them on the left column, and it provides a list of panels on the right column that display various debug information about the each of request/response, like version, time, settings, header, SQL, and static files. And when click on each of the panel, more detail information will display in the middle.
This tool replies on a Chrome extension, so use Chrome and install Django Debug Panel] from Chrome store.
To enable this debug panel, set following to hue.ini. If you are using Cloudera Manager, put them in Safety Valve.
[desktop]

\# Enable or disable debug mode.

django_debug_mode=true

\# Allow use django debug tool with Chrome browser for debugging issue, django_debug_mode must be true also

enable_django_debug_tool=true

\# Comma separated list of users' username that allow to use django debug tool. If it is empty, all users are allowed.

django_debug_tool_users=admin,ying
Reference:
https://github.com/jazzband/django-debug-toolbar