Quite some time ago (in 2014), a post demoed how to manually ingest some Apache Logs into Apache Solr and visualize via the Dynamic Dashboards. Nowadays, streaming data vs batching data is getting popular.
This follow-up is actually levering the Flume / Solr blog post from Cloudera which contains more context about the format and services.
Hue already comes with an Apache Log collection that contain a schema with additional information like the city, country, browser user agent. As a Hue admin, clicking on your username in the top right corner, then ‘Hue’ Administration, ‘Quick Start’, ‘Step 2: Examples’, ‘Solr Search’ will install the default index and dashboard.
Next, it is time to add some live data.
Listing Indexing
Here we are leveraging Apache Flume and installed one agent on the Apache Server host. If you have multiple machines to collect the logs from, we would need to add one agent on each host.
Then in Cloudera Manager, in the Flume service we enter this Flume configuration:
tier1.sources = source1

tier1.channels = channel1

tier1.sinks = sink1

tier1.sources.source1.type = exec

tier1.sources.source1.command = tail -F /var/log/hue/access.log

tier1.sources.source1.channels = channel1

tier1.channels.channel1.type = memory

tier1.channels.channel1.capacity = 10000

tier1.channels.channel1.transactionCapacity = 1000

\# Solr Sink configuration

tier1.sinks.sink1.type = org.apache.flume.sink.solr.morphline.MorphlineSolrSink

tier1.sinks.sink1.morphlineFile = /tmp/morphline.conf

tier1.sinks.sink1.channel = channel1
Note: for a more robust sourcing, using TaildirSource instead of the ‘tail -F /var/log/hue/access.log’. Additionally, a KafkaChannel would make sure that we don't drop events in case of crashes of the command.
Note: when doing this, we need to make sure that the Flume Agent user runs as a user that can read the ‘/var/log/apache2/access.log’ file.
Note: this is how to create the Kafka topic via the CLI (until the UI supports it):
kafka-topics -create -topic=hueAccessLogs -partitions=1 -replication-factor=1 -zookeeper=analytics-1.gce.cloudera.com:2181
Note: as explained in previous Cloudera blog post, the ‘/tmp/morphline.conf will grok and parse the logs and convert it into a table. Depending on your Apache webserver, you might or might not have the first hostname field.
demo.gethue.com:80 92.58.20.110 - - [12/May/2018:14:07:39 +0000] "POST /jobbrowser/jobs/ HTTP/1.1" 200 392 "http://demo.gethue.com/hue/dashboard/new_search?engine=solr" "Mozilla/5.0 (X11; Ubuntu; Linux x86_64; rv:59.0) Gecko/20100101 Firefox/59.0"
columns: [C0,client_ip,C1,C2,time,dummy1,request,code,bytes,referer,user_agent]
We also used the UTC timezone conversion as Solr expects dates in UTC.
[/code]
inputTimezone : UTC
The Geo database "/tmp/GeoLite2-City.mmdb" comes from [MaxMind][8].
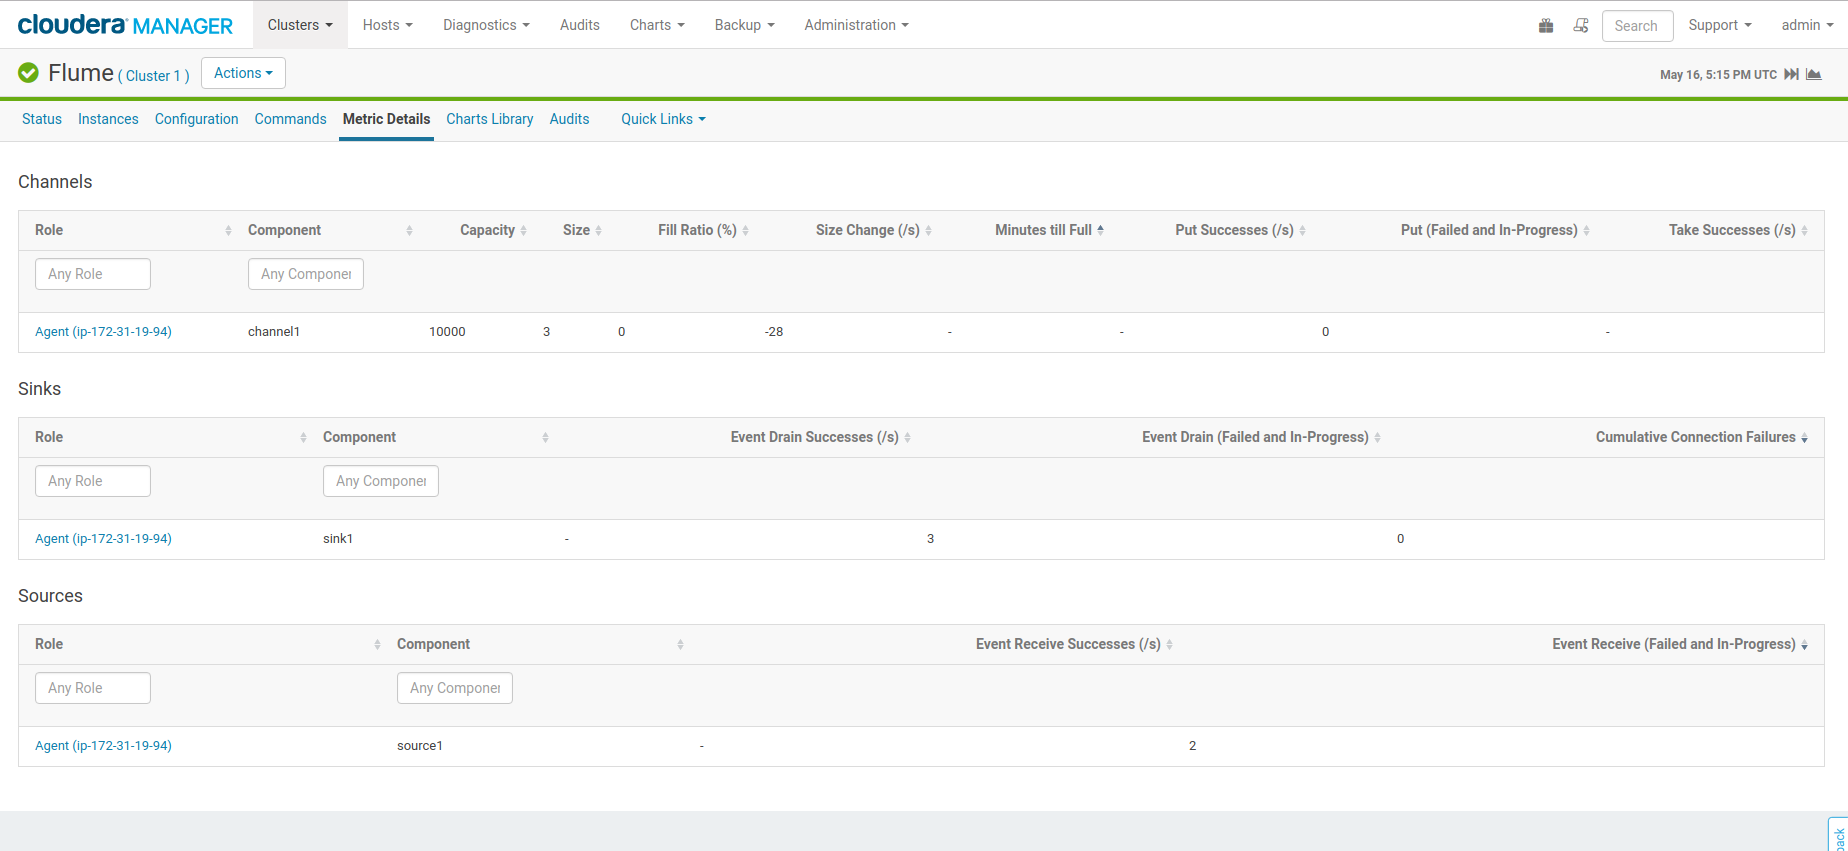
After the refresh of the Flume configuration, the Metrics tab will show the business of the pipeline. Looking at the logs of Solr will bubble some potential indexing issues.
Note: if you want to delete all the documents in the log_analytics_demo collection to start fresh, you could delete and recreate it via Hue UI or issue this command:
curl "http://demo.gethue.com:8983/solr/log_analytics_demo/update?commit=true" -H "Content-Type: text/xml" -data-binary '\*:\*
Live Querying
With the log info flowing streamed directly into the index, the Dashboard becomes a powerful tool for live data analytics.
In particular, the Timeline widget is a pretty good way to see the flow of data. The Analytics Facets in Solr 7 are now supported and make it even more compelling by providing easy way to calculate by dimensions.
Feel free to play with the live dashboard on demo.gethue.com, it was configured the same way!
As usual feel free to send feedback to the hue-user list or @gethue or send improvements!


