Hue is getting easy to run with its Docker container and Kubernetes Helm package. Recent blog posts describes how to get access to logs and metrics. Even in a non distributed world it can get noisy to know how much time is being spent where in each user request.
Consequently, in the context of a Data Analyst, knowing why a certain query is slow can become problematic. On top of that, adding multiple tenants and users, and more than 20 external APIs and the fog about fine grain performances appears and its becomes extremely manual and time consuming to troubleshoot.
In order to help get clarity on where exactly each request time is being spent, Hue started to implement the Opentracing API. Jaeger was selected as the implementation for its ease of use and close support with Kubernetes. Here we will also leverage the Microk8s distribution that bundles it.
Setup
Hue now ships with the open tracing integration, and details about the current state of this feature are in the Tracing design document. To turn it on, in the hue.ini:
[desktop]
[[tracing]]
## If tracing is enabled.
enabled=true

## Trace all the requests instead of a few specific ones like the SQL Editor. Much noisier but currently required.
trace_all=true
On the Jaerger side, as explained in the quick start, it is simple to run it on the same host as Hue with this container:
docker run -d --name jaeger \
  -e COLLECTOR_ZIPKIN_HTTP_PORT=9411 \
  -p 5775:5775/udp \
  -p 6831:6831/udp \
  -p 6832:6832/udp \
  -p 5778:5778 \
  -p 16686:16686 \
  -p 14268:14268 \
  -p 9411:9411 \
  jaegertracing/all-in-one:1.14
And that’s it! Jaeger should show up at this page http://localhost:16686.
Tracing queries
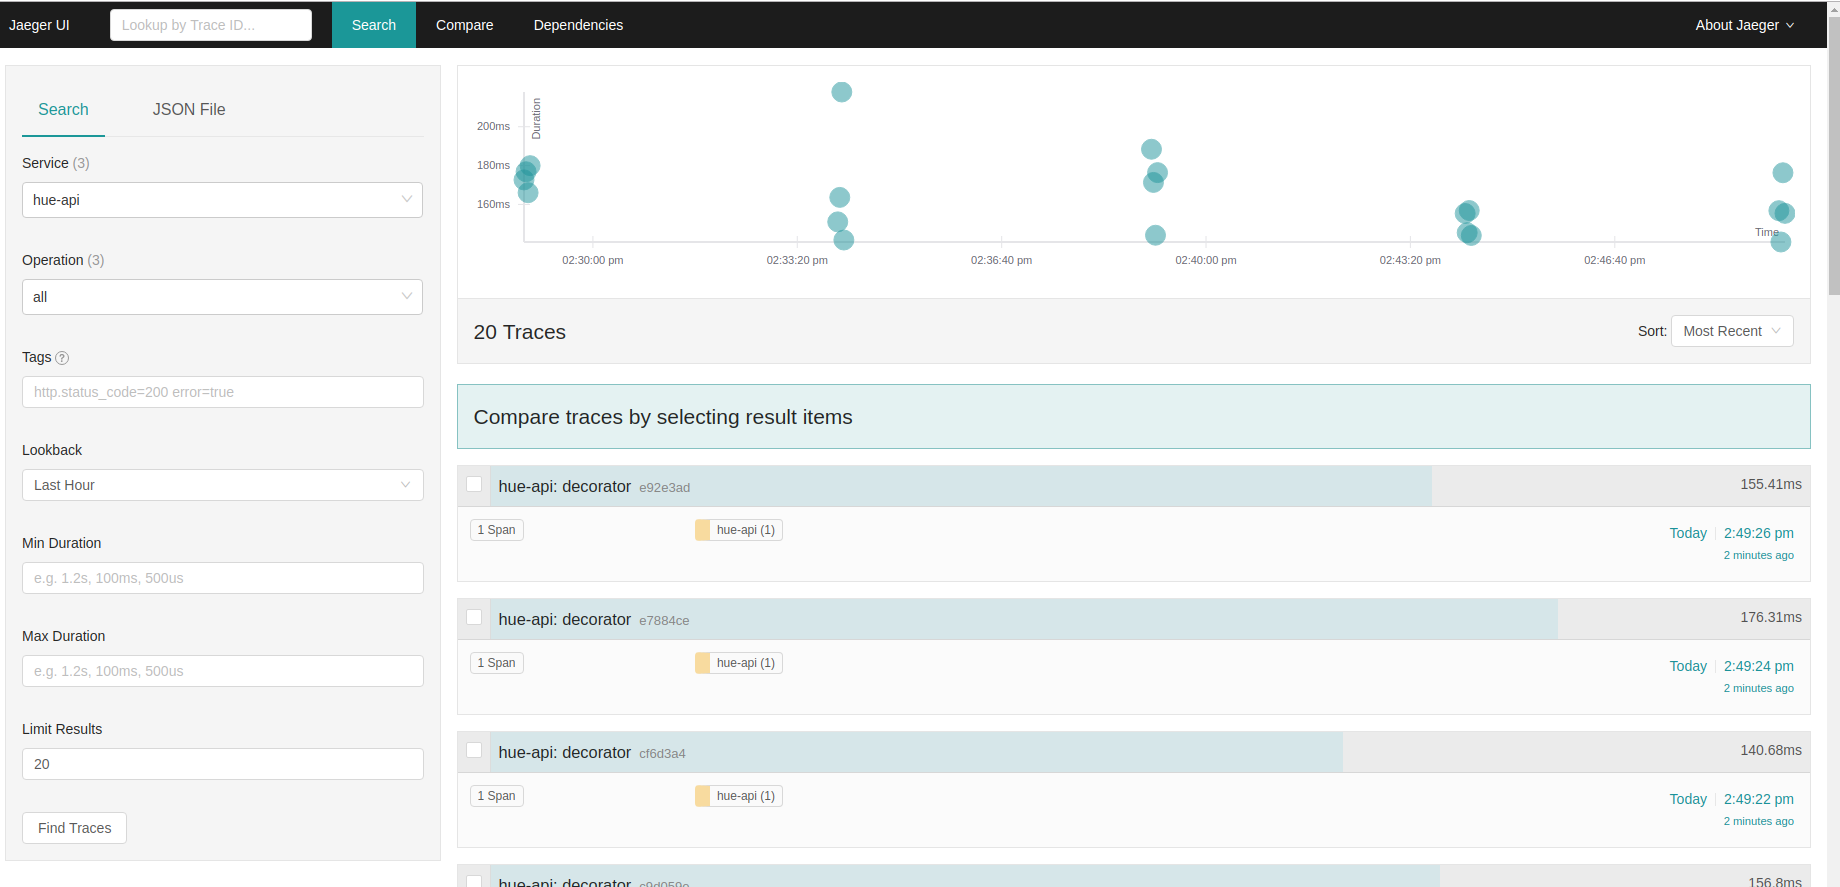
In the SQL Editor of Hue, execute a series of queries. In the Jaeger UI, if you then select the hue-api service, each external call to the queried datawarehouse (e.g. execute_statement, fetch_status, fetch_result… to MySql, Apache Impala…) are being traced. Below we can see 5 query executions that went pretty fast.
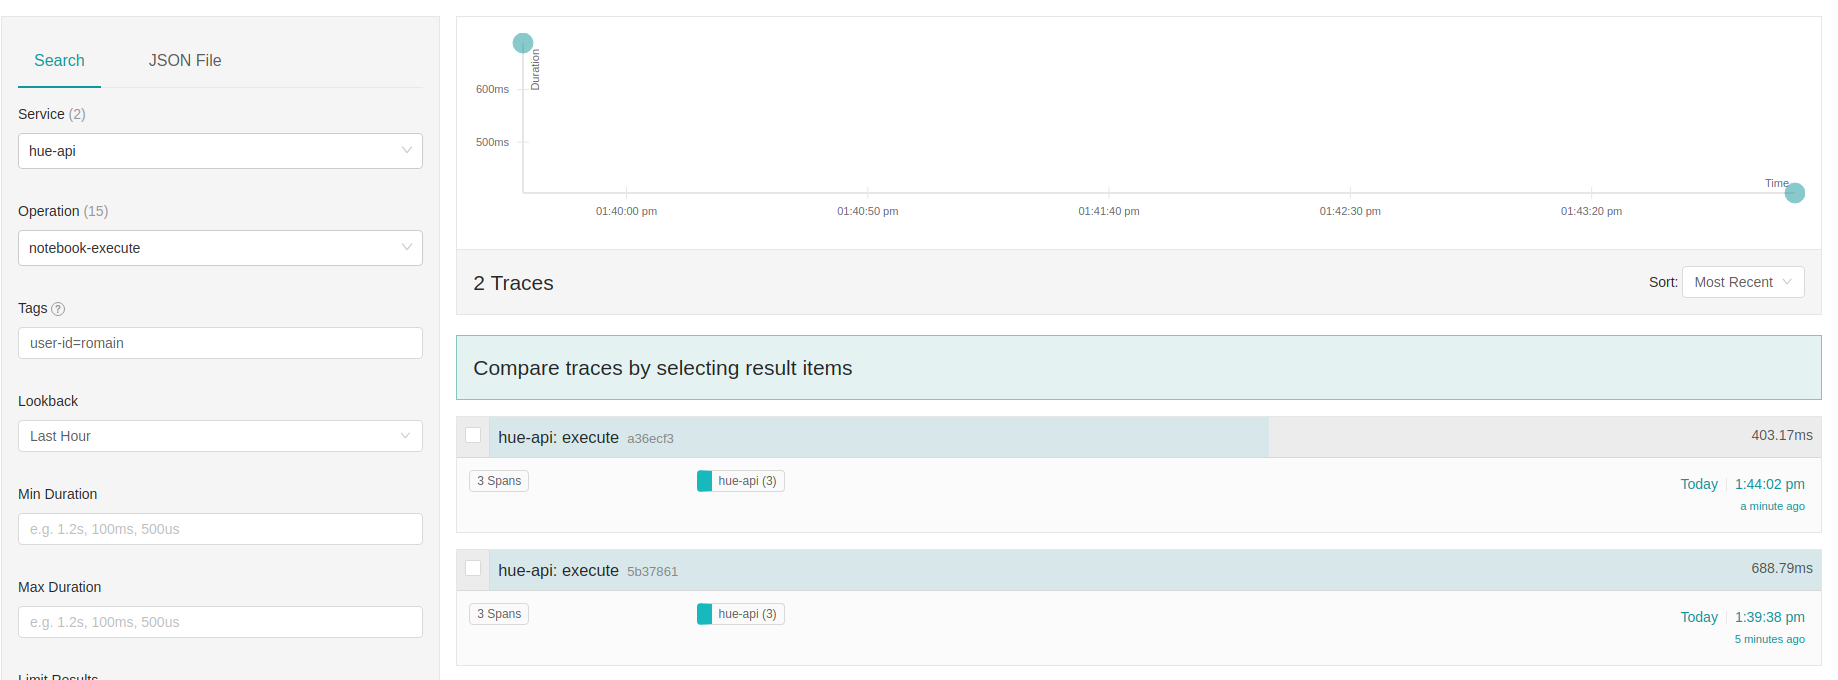
Fine grain filtering at the user or query level operation is possible. For example, to lookup all the submit query calls of the user ‘romain’, select ‘notebook-execute’ as the Operation, and tag filter via user-id=”romain”: