Greetings SQL aficionados!
In Hue 4.2, along with ADLS support, we're introducing a new feature that is sure to make query troubleshooting easier: Impala query execution details right inside of the SQL Editor.
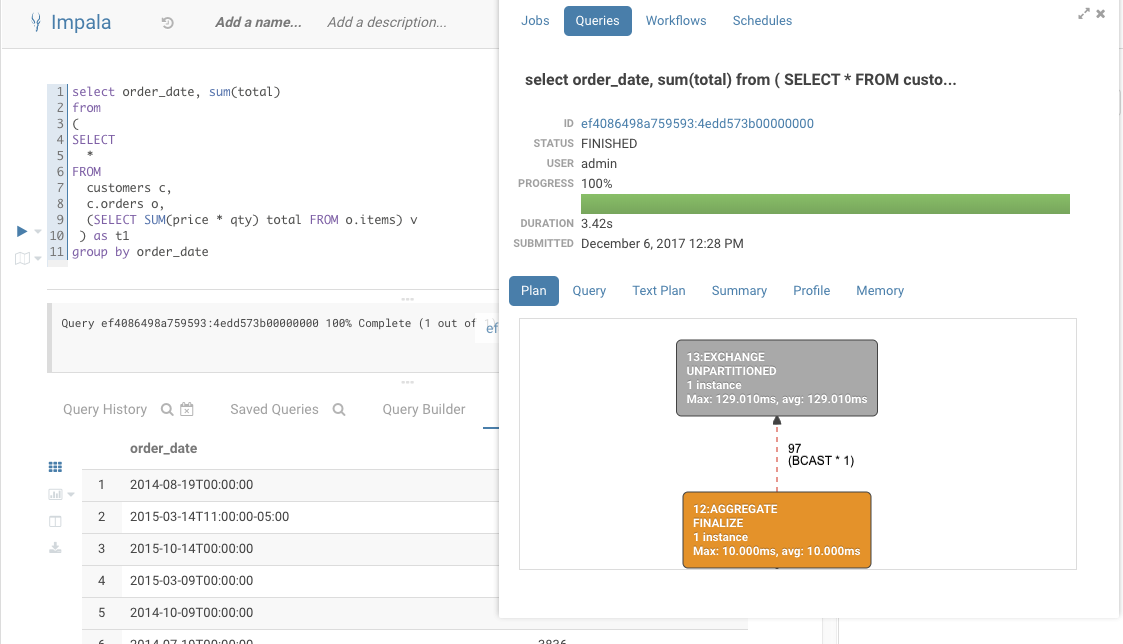
There are three ways to access the new browser:
- Best: Click on the query ID after executing a SQL query in the editor. This will open the mini job browser overlay at the current query. Having the query execution information side by side the SQL editor is especially helpful to understand the performance characteristics of your queries.
- Open the mini job browser overlay and navigate to the queries tab.
- Open the job browser and navigate to the queries tab.
Query capabilities
Display the list of currently running queries on the user's current Impala coordinator and a certain number of completed queries based on your configuration (25 by default).

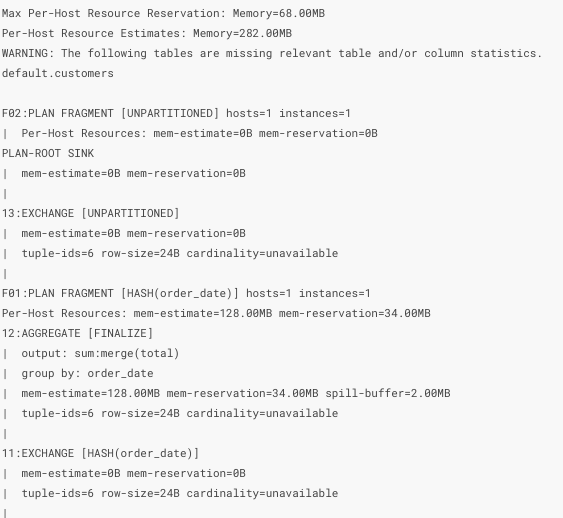
Display the explain plan which outlines logical execution steps. You can verify here that the execution will not proceed in an unexpected way (i.e. wrong join type, join order, projection order). This can happen if the statistics for the table are out of date as shown in the image below by the mention of “cardinality: unavailable”. You can obtain statistics by running:
COMPUTE STATS
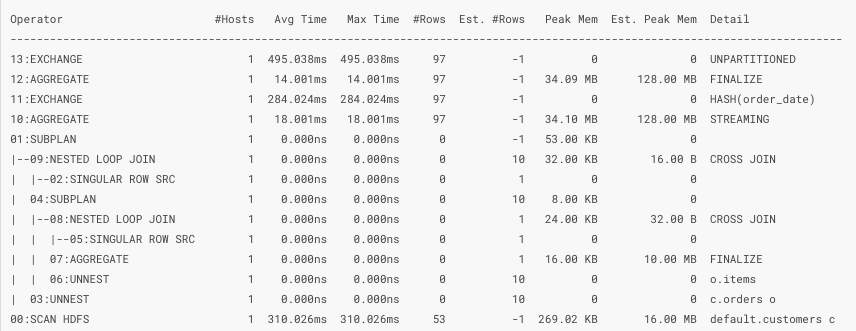
Display the summary report which shows physical timing and memory information of each operation of the explain plan. You can quickly find bottlenecks in the execution of the query which you can resolve by replacing expensive operations, repartitioning, changing file format or moving data.
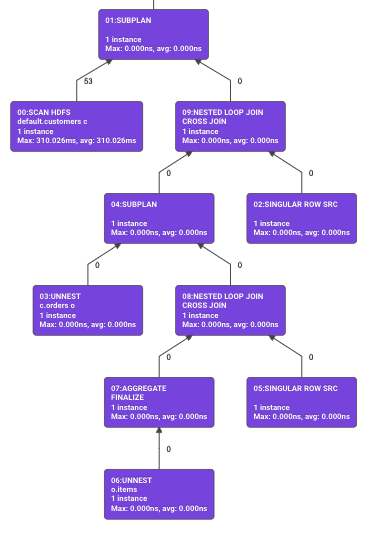
Display the query plan which is a condensed version of the summary report in graphical form.
Display the memory profile which contains information about the memory usage during the execution of the query. You can use this to determine if the memory available to your query is sufficient.

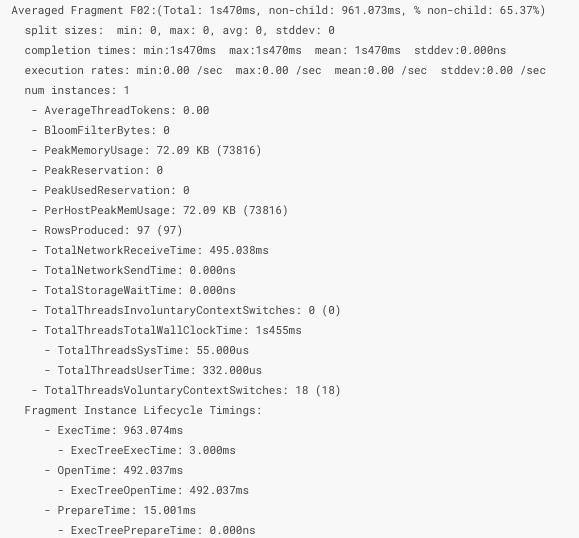
Display the profile which gives you physical execution of the query in great detail. This view is used to analyze data exchange between the various operator and the performance of the IO (disk, network, CPU). You can use this to reorganize the location of your data (on disk, in memory, different partitions or file formats).
Manually close an opened query.
The enable_query_browser flag should be on by default. All you need to access the new browser is to make sure Impala is configured inside of Hue.
[impala]

server_host=

server_port=

[jobbrowser]

enable_query_browser=true
As always, if you have any questions, feel free to comment here or on the hue-user list or @gethue!
