Hue is getting easy to run with its Docker container and Kubernetes Helm package. Hue metrics are useful for checking the load (how many users), slowness (average or percentile times taken by requests)… Those have been available via the /metrics page, but here is how to collect and aggregate this information in Kubernetes.
Prometheus is the metric collecting system heavily used in the Kubernetes world. Here we will leverage the Microk8s distribution that bundles it.
First we install the Prometheus operator via the add-on:
microk8s.enable prometheus
And see that the Prometheus operator is running, which powers the Prometheus pods in the monitoring namespace:
kubectl get pods -n monitoring
NAME                                   READY   STATUS    RESTARTS   AGE
alertmanager-main-0                    2/2     Running   268        48d
grafana-7789c44cc7-7c4pb               1/1     Running   125        48d
kube-state-metrics-78c549dd89-kwmwg    4/4     Running   512        48d
node-exporter-zlg4s                    2/2     Running   259        48d
prometheus-adapter-644b448b48-7t8rt    1/1     Running   131        48d
prometheus-k8s-0                       3/3     Running   364        47d
prometheus-operator-7695b59fb8-k2qm2   1/1     Running   130        48d
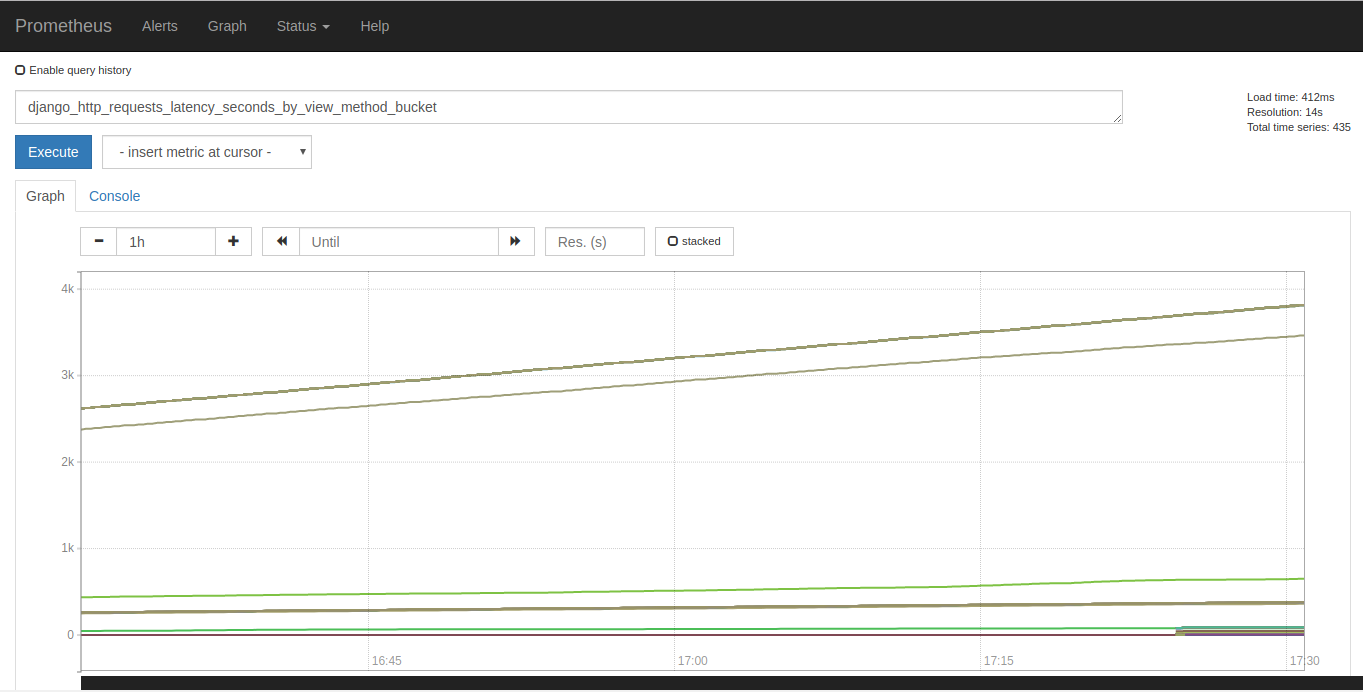
To tell Prometheus how to get the metrics, we use a ServiceMonitor. Those metrics are available on the /metrics page of Hue via the Django Prometheus module.
Note that to expose this URL, Hue needs to have this property turned on:
[desktop]
enable_prometheus=true
Then we can check that Prometheus is scraping properly Hue: http://gethue:9090/targets

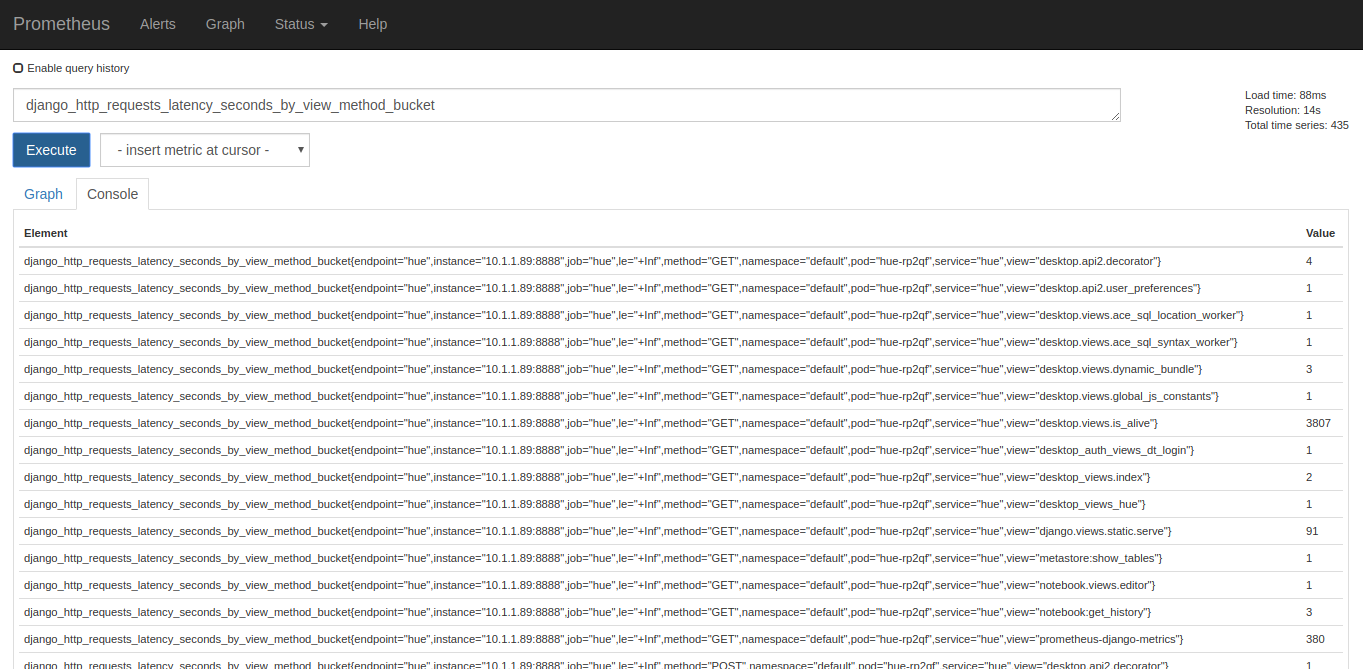
And charting them in the Graph tab: