Hue is getting easy to run with its Docker container and Kubernetes Helm package. Then when the service is up, let’s see how we can retrieve and analyse the logs.
Fluentd is a log management system that is heavily used in the Kubernetes world. Here we will leverage the Microk8s distribution that bundles it.
First we install the fluentd add-on:
microk8s.enable fluentd
And see that the Elastic Search, Fluentd and Kibana UI are running:
kubectl get pods -A
NAMESPACE            NAME                                     READY   STATUS    RESTARTS   AGE
container-registry   registry-577986746b-btjdz                1/1     Running   299        96d
default              hue-rp2qf                                1/1     Running   69         32d
default              nginx-hue-85df47ddd7-bbmwk               1/1     Running   129        48d
default              postgres-hue-6cpsz                       1/1     Running   72         32d
kube-system          coredns-5874dcd95f-cnkfl                 1/1     Running   239        84d
kube-system          elasticsearch-logging-0                  1/1     Running   117        47d
kube-system          fluentd-es-v2.2.0-pp7qb                  1/1     Running   401        33d
kube-system          hostpath-provisioner-6d744c4f7c-9dgnv    1/1     Running   123        47d
kube-system          kibana-logging-df8d4c8fd-kms74           1/1     Running   169        57d
kube-system          kube-dns-6bfbdd666c-gzbh9                3/3     Running   369        47d
kube-system          metrics-server-v0.2.1-57dfcb796b-9v7dn   2/2     Running   832        114d
kube-system          tiller-deploy-765dcb8745-zlm6t           1/1     Running   382        106d
Microk8s automatically ships the logs of each container. If you are curious, here is one way to see its configuration:
kubectl edit configmaps fluentd-es-config-v0.1.5 -n kube-system
containers.input.conf: |2-

    <source>
      @id fluentd-containers.log
      @type tail
      path /var/log/containers/*.log
      pos_file /var/log/es-containers.log.pos
      tag raw.kubernetes.*
      read_from_head true
      <parse>
        @type multi_format
        <pattern>
          format json
          time_key time
          time_format %Y-%m-%dT%H:%M:%S.%NZ
        </pattern>
        <pattern>
          format /^(?<time>.+) (?<stream>stdout|stderr) [^ ]* (?<log>.*)$/
          time_format %Y-%m-%dT%H:%M:%S.%N%:z
        </pattern>
      </parse>
    </source>

    <match raw.kubernetes.**>
      @id raw.kubernetes
      @type detect_exceptions
      remove_tag_prefix raw
      message log
      stream stream
      multiline_flush_interval 5
      max_bytes 500000
      max_lines 1000
    </match>
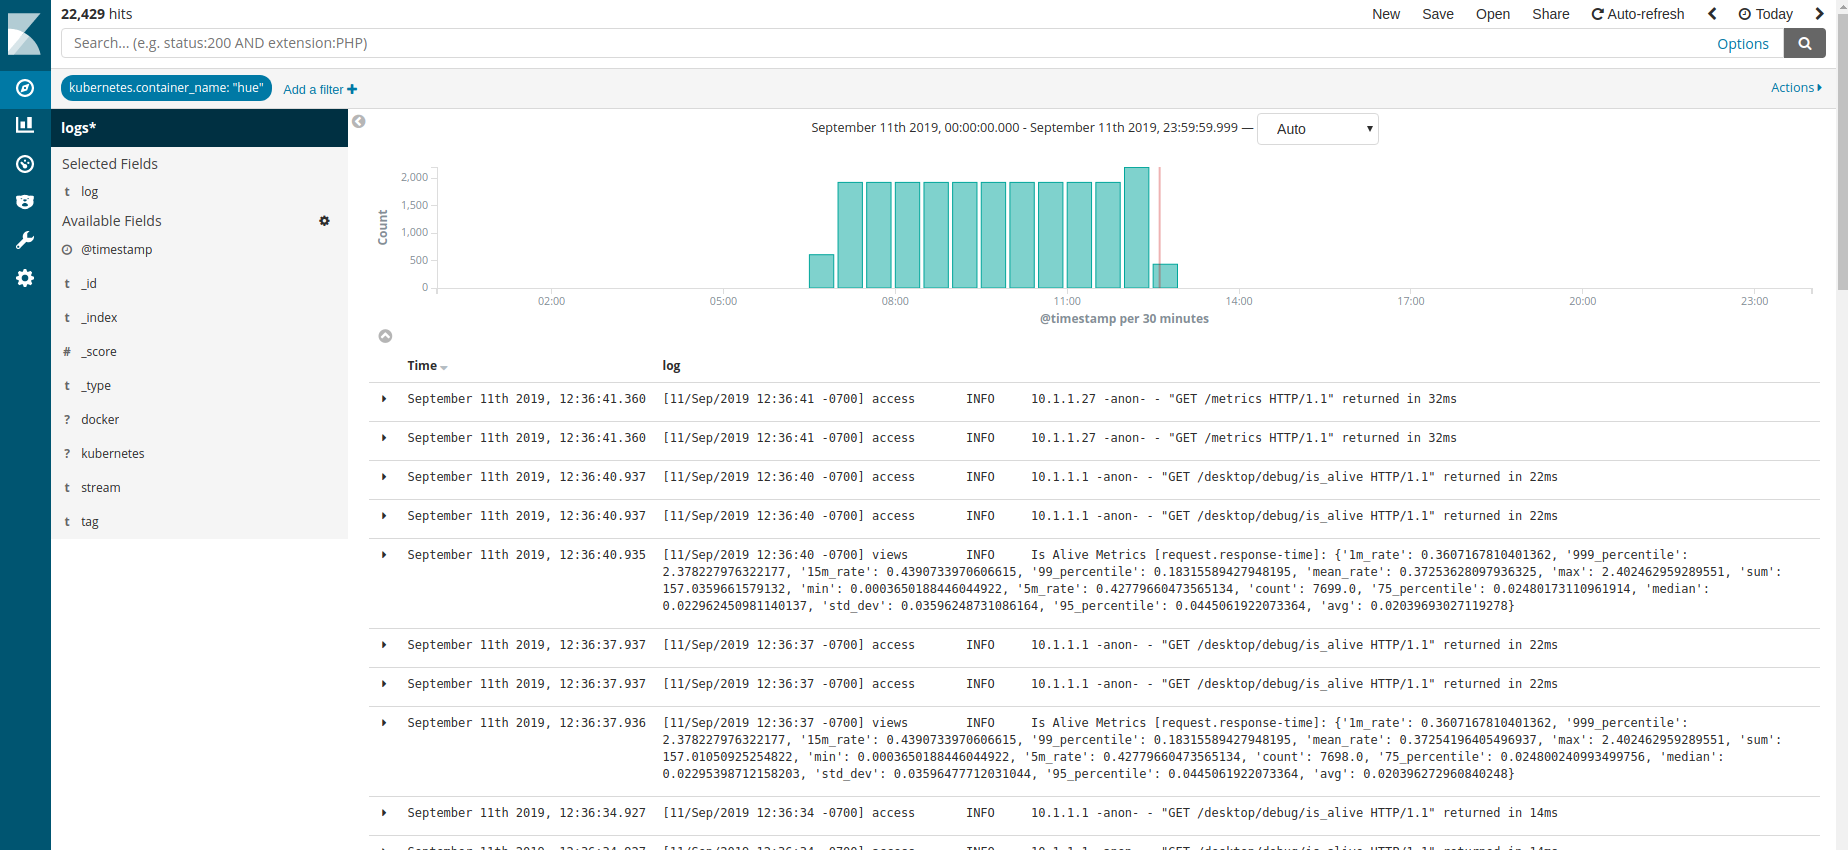
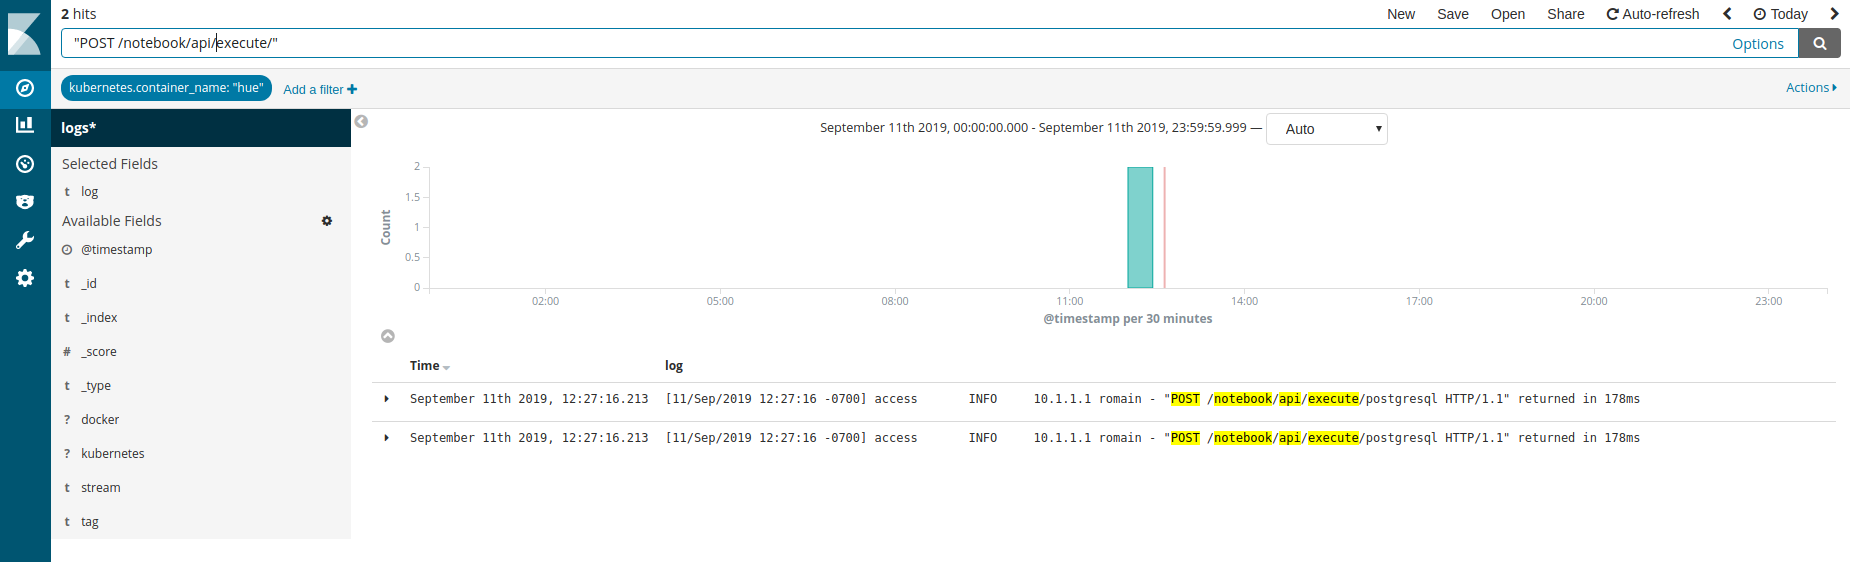
Fluent inject some metadata to each log line. It contains information about Kubernetes properties like container and image names. Now let’s open the Kibana UI and look at the “hue” container logs:
https://127.0.0.1:16443/api/v1/namespaces/kube-system/services/kibana-logging/proxy/app/kibana#/discover?_g=(refreshInterval:(display:Off,pause:!f,value:0),time:(from:now%2Fd,mode:quick,to:now%2Fd))&_a=(columns:!(log),filters:!(('$state':(store:appState),meta:(alias:!n,disabled:!f,index:b51668f0-a9aa-11e9-afc4-53db22981ed0,key:kubernetes.container_name,negate:!f,params:(query:hue,type:phrase),type:phrase,value:hue),query:(match:(kubernetes.container_name:(query:hue,type:phrase))))),index:b51668f0-a9aa-11e9-afc4-53db22981ed0,interval:auto,query:(language:lucene,query:''),sort:!('@timestamp',desc))
The credentials can be seen by looking at the bottom of the command:
microk8s.config
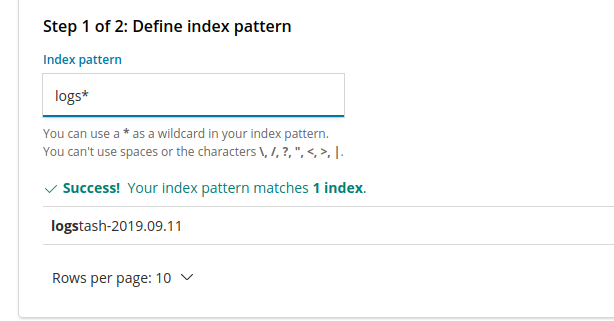
Then select the indexes with the “logs*” patterns and use “@timestamp” as the time field: